Exceeds Ink: The agentic intelligence layer
Insights and outcomes from prompt to PR
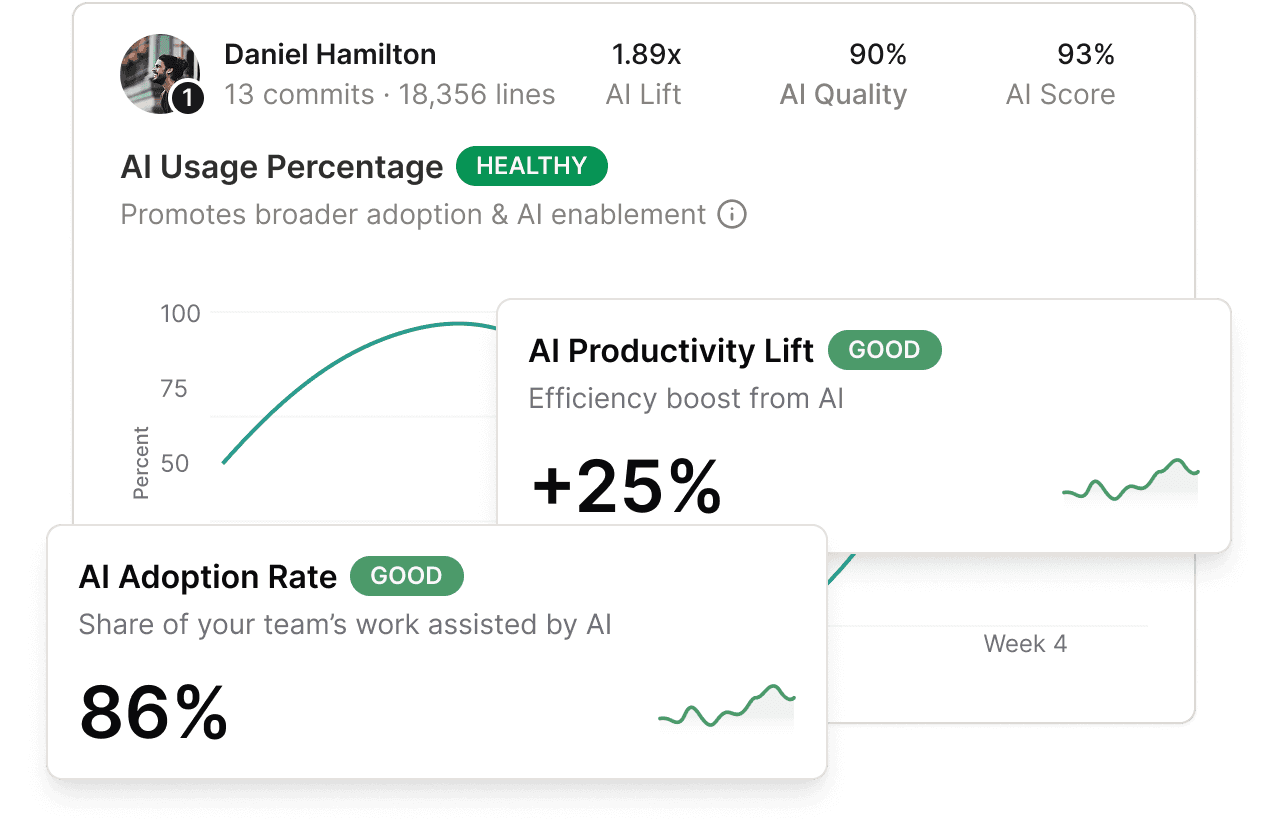
Token-level attribution for each engineer from prompt through PR. Systematize the best tactics and flows from your strongest engineers. The only platform that provides leaders token-to-outcome attribution.
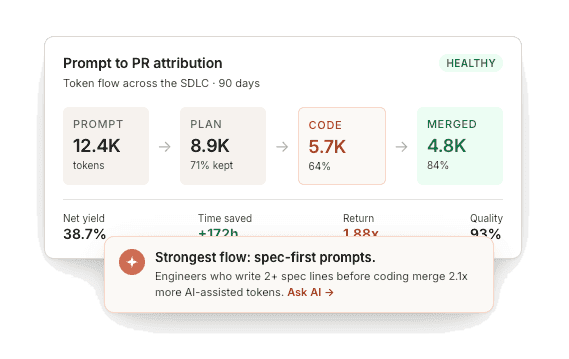
Prompt to PR attribution
Token flow across the SDLC · 90 days
PROMPT
12.4K
tokens
PLAN
8.9K
71% kept
CODE
5.7K
64%
MERGED
4.8K
84%
Net yield
38.7%
Time saved
+172h
Return
1.88x
Quality
93%
Strongest flow: spec-first prompts.
Engineers who write 2+ spec lines before coding merge 2.1x more AI-assisted tokens. Ask AI